
Better Than a Coin Flip
Mouseover text
Three wrong answers make a quorum.
Appears in Reliable Machines From Unreliable Parts
Transcript
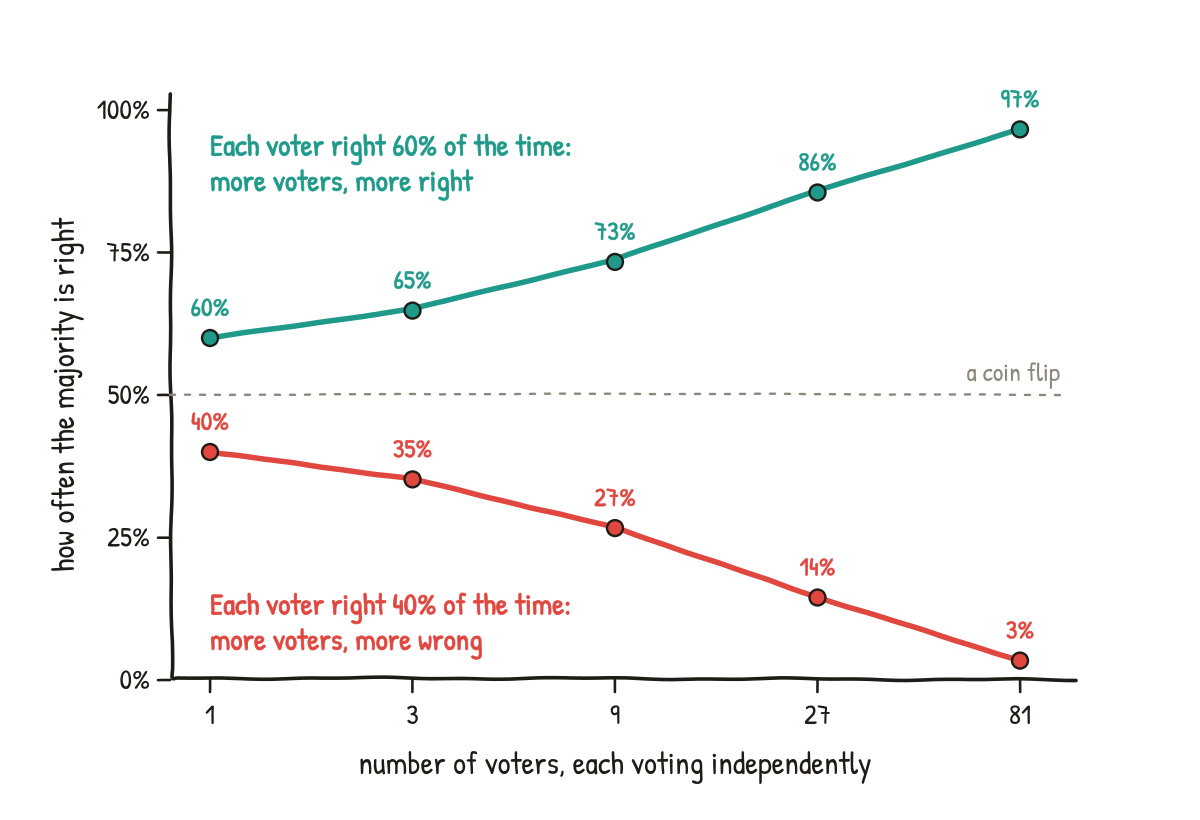
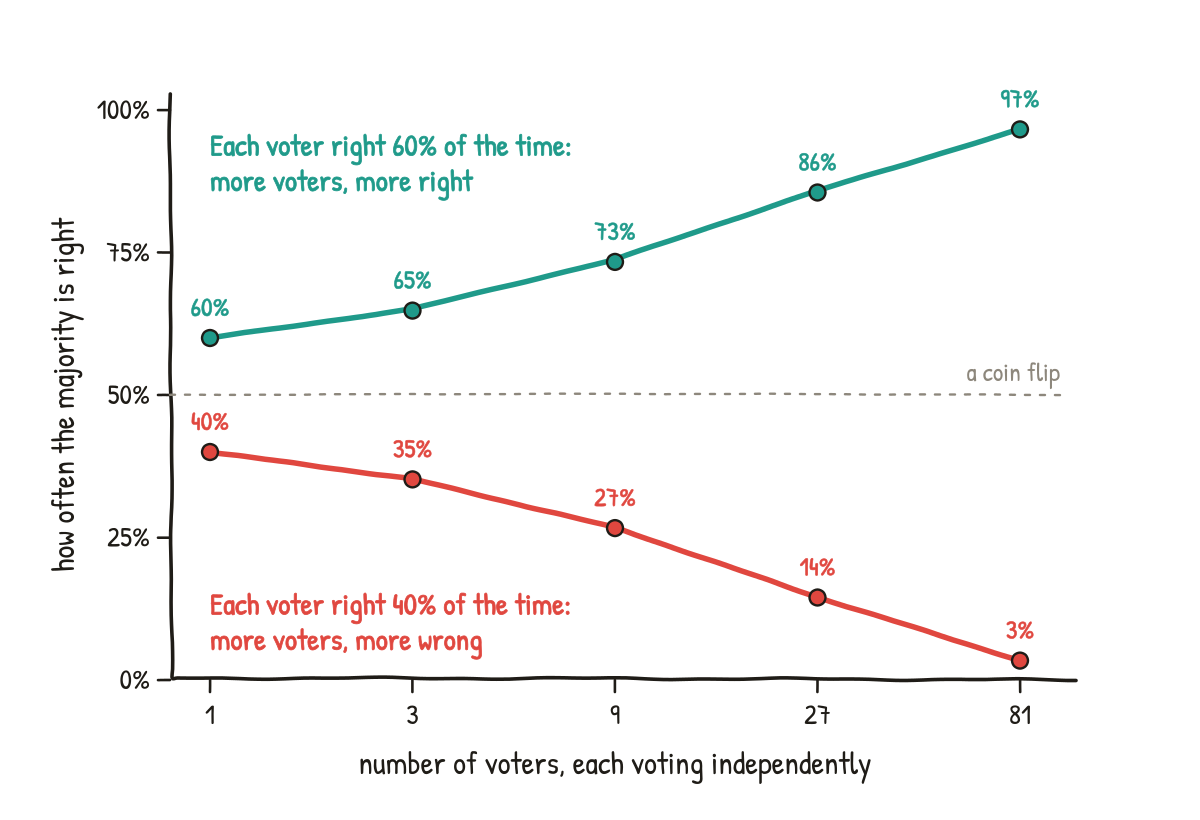
How often the majority is right, against the number of voters: 1, 3, 9, 27 and 81, each voting independently. A dashed line at 50% marks a coin flip.
Each voter right 60% of the time: more voters, more right. 60%, 65%, 73%, 86%, 97%.
Each voter right 40% of the time: more voters, more wrong. 40%, 35%, 27%, 14%, 3%.